In the last column, I discussed joint goals and how to promote the operations/maintenance partnership through a different way of reporting and solving operations problems, as well as maintenance ones.
In this and in the December article, I will continue to elaborate around the vital relationship between operations, maintenance, and engineering.
ESTABLISH THE RIGHT FOCUS.
If you agree with the ideas presented in the August column—that the relationship between operations and maintenance should be a partnership, not a customer/supplier relationship—the next step in promoting this partnership is to establish the right focus in your joint improvement effort.
So, if maintenance is not a service provider, what does maintenance deliver? I think that both maintenance and operations deliver reliability. The maintenance department delivers equipment reliability and the operations department delivers process reliability.
Reliability can be defined as “Quality production output at expected speed without downtime, personal injuries, or environmental damages,” or the same as OPE or overall production efficiency (see August column).
It can be measured as OPE or with the following formula: MTBPL/MPL, where MTBPL = mean time between production loss and MPL = mean production loss. The term “production loss” is suggested rather than the more common reliability term “MTBF” (mean time between failures).
The reason for this is that you should stress the fact that you want to avoid operational problems, as well as equipment problems. The term “failure” is too often related to technical equipment failures (maintenance).
If you have decided to focus your improvement efforts on reliability improvements that will result in sustainable, lower maintenance costs, I advise you to find out the revenue of increased reliability as it compares to the value of reducing maintenance costs.
A common way of doing this is to estimate the average market price for a product or a product mix over the last five years.
Then, deduct the variable cost to make the product over the same time period. For example: a pulp mill received an average market price of $700/ton for its product mix. The variable cost to make a ton was $340.
The financial contribution the mill will receive for each ton made and sold is consequently $360 per ton.
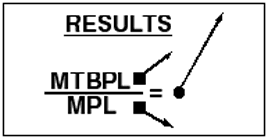
As shown in the graph, your joint goal is to continuously increase MTBPL and decrease MPL. The combined results of this will be a reliability factor of, for example, 50.4. Your joint operations/maintenance goal is to continuously increase this factor.
The next thing you need to do is to identify the bottleneck of the process line making the product and the OPE of this process.
If the bottleneck is the bleach plant and the OPE there is 84%, the potential opportunity to increase OPE is most probably in the area of 6% to 10 %.
Assuming that the pulp dryer machines and baling lines can handle the increase in production and your present throughput is 500,000 tpy, the value of a 5% increase in production throughput is worth 25,000 tons x $360 = $9,000,000/year.
The maintenance cost for this pulp mill is $87/ton or a total of $43,500,000/year. A 5% reduction in maintenance costs would be worth $2,175,000/year, or 24% of the value of increased and sold production.
In this example, it should be obvious that your joint operations/maintenance focus should be reliability.
A lower maintenance cost will then follow as your reliability increases. The problem is that your boss might ask you to do both at the same time, or even worse, ask you to first cut the maintenance cost and then focus on reliability.
My experience has shown over and over again that this approach will fail.
My next column will appear in the December 2000 issue of Pulp & Paper.
part1 | part 3 | part4 | part5