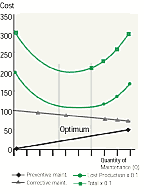
For decades, many “experts” have used the graph in Figure 1 to discuss the optimum level of maintenance.
This Figure is based on an old-fashioned, yet widespread approach that bases preventive maintenance on Fixed Time Maintenance (FTM) replacements and overhauls of components. This approach is seldom justifiable because only 15% to 20% of all components fail after a predictable time.
As the graph shows, the more this type of maintenance is performed, the larger the cost for preventive maintenance becomes.
Concurrently, the cost for corrective maintenance is supposed to go down.
The cost for production losses is believed to go down to a point where you need to shut down equipment more frequently for preventive maintenance, and, as a result, the cost of lost production starts increasing.
The top total curve in Figure 1 is the sum of the other curves and shows what the optimum level of maintenance should be.
Preventive Maintenance Optimization: The Right Approach
A modern and cost-effective approach to preventive maintenance shows that there is no maintenance cost optimum.
Instead, maintenance costs will decrease at the same time as costs for production losses also decrease.
This approach can be summarized as follows;
No preventive maintenance action is performed unless proven to be less costly then the failure. A simple consequence of failure analysis (CFA) is made to justify preventive maintenance activities.
Preventive maintenance activities are primarily condition-based.
The condition of a component, measured when the equipment is in operation, governs planned and scheduled corrective maintenance. It is acceptable to operate a component to breakdown when it is the most cost-effective maintenance procedure.
A standard corrective maintenance procedure should be developed and documented.
Define the need for corrective maintenance early on (Condition Monitoring) as a part of preventive maintenance. Correcting the problem is defined as planned and scheduled maintenance.
Practicing this maintenance philosophy will transform the earlier graph to that of Figure 2. Here, the cost for preventive maintenance is very low, especially if operators are trained and motivated to do some essential care and inspections.
A plant might end up having less than 5% of the traditional work force allocated for preventive maintenance. As with Figure 1, the top total curve in Figure 2 is the sum of the other curves and shows what the optimum level of maintenance should be.
With this improved maintenance philosophy, the level of planned and scheduled corrective maintenance will increase to over 80% and total maintenance volume and costs will go down 20% to 30%.
More significantly, reliability will improve and production throughput will be faster.
This results in lower costs for lost production. And, because preventive maintenance activities are cost-justified based on failure-developing periods and failure distribution in time, total costs are continuously decreasing.
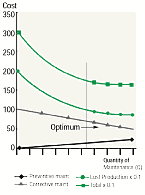
Figure 1:Wrong approach to maintenance
Figure 2: Right approach to maintenance.
This example is a true case from many plants with an almost identical manufacturing process. To help the maintenance manager optimize maintenance of the bearings in the screen, we made a short consequence of failure analysis of different scenarios that might occur and then put a financial value to each of them.
If we accept the failure developing principles described in the May/June issue of this magazine we can use this as a methodology to bridge the gap between a technical solution and financial language. It is obvious that the manufacturer’s recommendations are wrong and you do not need to be an expert on their equipment to prove this fact. Attaching a vibration transducer in each bearing housing and pull wires to a point outside of screen is of course a better and more financial viable solution.
As a case study I like to use a discussion I have had in many plants with groups of experienced maintenance professionals.
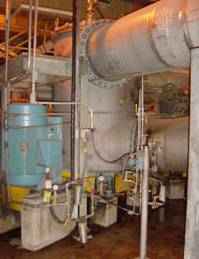
Picture 1. The picture shows a rotating screen where incoming media is separated in good product, and reject. The inside rotary assembly rotates with 350 rpm inside a stainless steel basket with drilled holes. The diameter of stainless steel basket is one meter. The inside bearings are lubricated through two pipes. The rotary assembly is driven by an electric motor and V-belts. If the function of the screen ceases, it will shut down a process at a cost of Euro 20000 per hour in lost production. A break down of the bearings might cause the rotary assembly and the stainless steel basket to be destroyed at a cost of Euro 100000.
There are three options we can choose from to maintain the bearings:
- O.T.B = Operate To Break Down
- F.T.M = Fixed Time Maintenance
- C.B.M = Condition Based Maintenance
If we chose O.T.B. the job to change bearings and very possibly also V-Belt drive and other damaged components can be planned, but not scheduled. We can make sure we keep spare parts in store, our people know how to do the job, what special tools are needed etc. This often leads to that we keep some very expensive parts in store to prepare for the worst case scenario. It is likely to occupy at least six people to correct the break down.
They will not all work, but because scope of work was unknown when the symptoms of the broken down screen function was noticed, all available resources would migrate to the broken down screen and it is likely we would call more people than necessary for overtime. In most plants the unscheduled break down is 76.2 % likely to happen when the maintenance crew is not there.
So they have to be called in on overtime or you fall into the bad habit of having maintenance people on shift. This is of course not only because of this equipment but because most maintenance is reactive in nature.
If we choose F.T.M. we can both plan and schedule the job. In this case the process line has scheduled clean up and process material shut downs every four weeks during eight or alternating twelve hours. It will be easy to plan and schedule this job during one of these shut downs thus avoiding any lost production due to screen maintenance.
We would still have to keep a very expensive exchange part in store because without it, it would take longer time to replace bearings than allowed by the scheduled shut downs.
The disadvantage of F.T.M. is that we will over maintain the screen, work has to be done more frequent than necessary. It is always the risk that we will induce failures to components when they are disassembled and assembled.
The fact is that the estimated life of new bearings is 1 – 15 or even 1- 25 years so it is obvious that we will never know if we replaced good bearings with good once.
If we chose C.B.M. we optimize maintenance of the bearings in the screen. The assumed break down frequency used to calculate cost for O.T.B. will be the same. You can not detect more failures than you assumed would occur. The failure frequency might not be right, but the comparison between costs for O.T.B. and C.B.M. is right.
Here, a break down frequency of one failure per year will occur.
On an annual cost basis that is 1/5 or 0.2 failures per year. In the O.T.B. case the failure will develop to a break down. Repair time for break down is 12 hours with six people. Cost for crafts people is 40 Euro per hour (Plus extra cost for very likely overtime and management/supervision time).
The material cost is the cost for bearings and V belt drive. If it is estimated to take 12 hours to repair, it will cause 15 hours of lost production @ 20000 Euro per hour before process is up running making quality product.
The worst case scenario is that the rotary assembly will destroy the stainless steel basket which will cost 100000 Euro to replace, in the best case scenario this will not occur. In the example above we have assumed a 50% likelihood that worst case scenario will occur.
In this example cost to carry spare parts is not included. In the O.T.B. alternative a full set of the rotary assembly and screen will be stocked at a carrying cost of 30000 Euro per year. In the other cases this cost will be much lower or even 0.
To do C.B.M transducers at a cost of 1500 Euro must be installed and it is apparent that it will pay off. If this had been specified when the screen was purchased the cost would have been 700 Euro and two break downs would have been prevented.
With the above example we have shown the financial impact of Optimized Preventive Maintenance. The difference in cost can be 1 – 100 as in the example above.
It must be made clear that in most cases an analysis like the one described here is not necessary to do.
Only about 5% of all components require an analysis to decide the most cost effective maintenance method, for most other components the best maintenance procedure can be decided in a much less time consuming way.