I was asked a question recently about the level of spare parts inventory that should be carried as a percent of the Asset Replacement Value (ARV).
This is not an unusual question. In fact, these types of questions come up frequently.
Maintenance of inventory turnover levels and storeroom value as a percentage of ARV are dependent on a host of factors specific to each plant. Because of the complexity of these calculations I have written a series of articles that should give you key benchmarks and trending factors that should be considered when managing your plants reliability efforts.
This article is first in a 4 parts series.
- Part 1 – Inappropriate Measures?
- Part 2 – Criticality Analysis as a precursor to your storeroom improvements
- Part 3 – ABC analysis and Economic Order Quantities
- Part 4 – Key Performance Indicators for your Maintenance Storeroom
Factors in Determining Storeroom Size
Your storeroom size will be determined on a number of factors. Below I have outlined what you should consider prior to determining your storeroom size needs.
- Commonality of parts
If your plant has a lot of special order, or small production series equipment, you are likely to be forced to carry larger volumes of parts in your inventory with a lower inventory turnover ratio. - Proximity to parts vendors
Consider both the geographical proximity to the original equipment manufacturer (OEM) and your parts wholesaler. Also take into account, plants located away from large airports and densely populated areas. - Extent and frequency of condition monitoring and preventive maintenance programs
Limited condition monitoring and preventative maintenance programs require you to carry a larger spare parts inventory. - Engineering design
The quality of the facility design work and thought that went into the designing processes at your location will have a heavy impact on the reliability and failure rates. Up to 80% of life cycle costs are decided at the early design stage where engineering specifications are created. This is what we then have to live with for the next 2-3 decades.
Figure 1 – Sprockets and bearings on slow moving equipment are among the first items you can eliminate with a periodic condition monitoring and preventive maintenance program.
To use parts consumption as percentage of asset value as a benchmark measure you will need the following information reported in a standardized way:
- Net Asset Value or Asset Replacement Value?
• General Ledger asset value including or excluding depreciation
• Insurance value of asset
• Current market replacement cost of asset
- Proportion of labor to parts cost, and the consumable cost at your plant. How much of the costs are not associated with labor.
- Inventory turnover ratio. This is a must, as you cannot compare plants with slower moving parts to plants that have inexpensive but more frequently exchanged parts.
Figure 2 – It takes a lot of consumables to raise the overall storeroom inventory turnover enough to offset a few large value items such as the fan assembly shown at top.
Net Asset Value or Asset Replacement Value?
It is common to see differences in measuring and reporting these values even between sites in the same corporation. Recently, a group of consultants audited the maintenance costs across multiple sites in a large corporation. It quickly became evident that even though all sites were supposed to use the same processes and classifications this was not true in practice.
Building consistency with reporting styles and ways of thinking to sites across large corporations is a long term process. This process starts with corporate leadership creating one procedure and set of reporting forms and communicating to the people from the different sites.
Proportion of Labor to Parts and Materials
This ratio is affected by your industry type, the technical expertise needed to maintain your facility, your operating country or state and, in some cases, the raw material prices. Over the years IDCON has determined that labor costs represents 40-60% of the overall maintenance costs, with parts and materials being the remainder of the total.
Inventory Turnover
It is often thought that Inventory turnover as the key performance indicator for maintenance storerooms, as it is successfully applied to other types of inventories. With retail and wholesale outlets high inventory turnover rate is preferred and expected. High inventory turnover does not hold true for many maintenance spares. Maintenance parts are not fast moving inventory, with inventory turnovers of many facilities lying at a factor of 0.7-1.3.
Consider these examples of items stocked by your storeroom:
- $150,000 rotating fan assembly with a 4 month lead time, you may use once in 8 years and cannot be hot-shotted to the plant. Stockout results in a long time to repair to the current unit until a new unit can be permanently installed in 4 months.
- $400 Impeller with a 2 week lead time, you use 27 a year at the standard shipping, but can be shipped over-night for $350 more.
- An $11 pair of gloves with a lead time of 3 days, you use 25 pairs a day and can be shipped overnight for $79 more.
- $250 25hp motor with a lead time of 2 weeks, you use 9 of a year and can be shipped overnight for $350 more.
Figure 3 shows an example inventory analysis with annual purchase volumes, use and stock values. While this distribution is skewed towards the high cost of the rotating assembly it is not uncommon to find skewed inventory distributions like this in actual practice today.
In the Figure 3 example, stock quantities have been set up:
- Option 1 – Lead time + 1
This example shows the quantity needed to bridge the lead time, plus a reserve for longer lead times. As the minimum, 1 rotating assembly is kept on hand due to its importance. - Option 2 – Tight
This example shows the minimum number of gloves needed to bridge the order lead time. The quantities of the other parts have been trimmed so that the inventory has only enough to bridge one failure before needing to shut down or hotshot in an additional unit. - Option 3 – Without Rotating Assembly
This example is calculated without is the rotating assembly
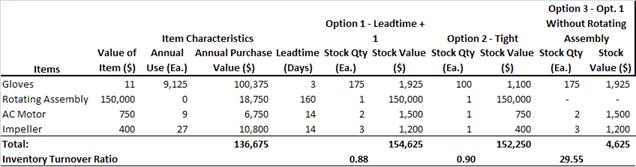
Figure 3 – Item characteristics and options for stock quantities with the results on total inventory values and turnover ratio.
Adjusting the volumes from Option 1 to Option 2 does little to reduce the overall inventory volume or to increase the inventory turnover ratio of our storeroom. It isn´t until Option 3, where the rotating assembly is cut out, that we manage to drastically raise the turnover ratio and decrease the storeroom holdings. But what cost is associated with Option 3?
Cost of Focusing on Turnover and Stockouts
To better assess Option 3, cutting out the rotating assembly, we need evaluate the cost associated with being without? In the Figure 4 below, the cost of stockout for gloves is estimated to be $0. To explain, if your mechanics or operators need gloves, it rarely because the old ones are completely unusable or worn out. The cost of downtime for AC motor and impeller is set to the 24 hours. This is the time it takes to bring the parts onto the plant. As we cannot hotshot our way forward on the rotating assembly, temporary repairs will be made until permanent replacement arrives in 4 months.
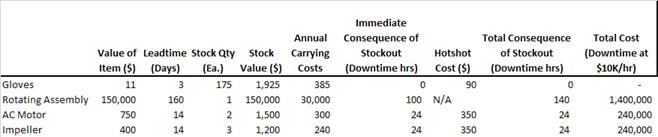
Figure 4 – Annual carrying costs and consequences of stockouts.
It is common for lines in large processing plants to have an hourly downtime cost of $10,000 per hour in lost contribution. These can constitute a large threat to the bottom line. In Figure 4 the goals of raising inventory turnover and lowering the Storeroom value, as percentage of replacement costs, must be weighed against the cost and risk of being out of production for up to 140 hours in the case of the rotating fan assembly failure.
Stockouts, defined as the percentage of time the storeroom is unable to deliver the right material is sometimes used as a performance indicator for storerooms. It should only be used in non-essential items and only where the business and safety risks are small and manageable. Or put another way, where the carrying costs of a part are high, compared to the risk of being without the part.
Figure 5 – How many of each of these bearings to carry we can determine through criticality analysis of your plant and ABC analysis of the storeroom.
To determine which items require inventory adjustment, we should encourage a higher inventory turnover ratio and focus our efforts for reducing inventories. To do this, we will first perform the Criticality Analysis, then ABC analysis and which will set the Economic Order Quantities (EOQ).
Through these analyses we can determine which parts you can tolerate having subject to stockouts, focus you on reducing inventory quantity by use of ABC analysis and determine which part purchases can be optimized economically.