Before we discuss current maintenance management best practices, we must first discuss comparing maintenance cost with ERV
You have been told you that your maintenance cost as a percent of estimated replacement value (ERV) is 4.6% and that this is too high.
Best performers, you are told, should have maintenance cost lower than 3% of ERV. (Our database shows that the average maintenance cost as percent of ERV in the process industry is 4.2%.)
So, now what do you do about this?
COMPARING MAINTENANCE COSTS
Before we discuss what you can do, I would like to discuss the reliability of maintenance cost comparisons between plants.
During the last year, I have worked with two companies that were competing in the same market segment with the same products. For years, cost comparisons, including maintenance costs, had been made between the two companies’ plants.
One company’s plants always had the lowest maintenance cost per ton.
Then, these companies merged and “overnight” the maintenance cost for the company with the lowest maintenance cost per product produced went up 50%!
The reason for this increase was different guidelines for what maintenance to expense and what maintenance to capitalize. The company with the lowest maintenance cost per ton capitalized as much as they could, while the other company expensed as much as they could.
When new guidelines were applied, the “low maintenance cost company” was told to follow the “high maintenance cost company’s” guidelines, so, instead of a maintenance cost of $60 per product produced, its cost was now close to $90 per product produced.
ESTABLISHING A RELIABLE ERV
A reliable ERV is equally difficult to establish. To make an attempt for getting it as close to right as possible, you need to go back to the original investment of the mill.
Then, you have to decide what index to use for estimating current replacement value. After that, you need to cluster all investments and divestments, for example, in a three-year time period. When all this is done, you can calculate ERV.
Well, I know that you will have to live with all these cost comparisons, and you will continue to argue over why they might be right or wrong. If the numbers are right and used for trending your own performance, they can be useful.
The most important matter will still be to do something about improving your competitiveness and your productivity.
So, whatever way you have been measured and compared, you will have to develop an action plan and then execute this action plan to improve the numbers used to compare you.
DEFINING CURRENT MAINTENANCE MANAGEMENT BEST PRACTICES
You can name maintenance any three-letter acronym you want, but if you break the maintenance function down to its elements or practices, you will soon notice that they will all have to be done in an efficient manner to deliver better performance.
So, what are these practices?
Many years ago we defined all these practices and have used them to evaluate and identify maintenance improvement opportunities in hundreds of maintenance organizations all over the world.
Recently, we sat down again with corporate management of a major international company to define all these practices. To no one’s surprise, these practices were the same as 30 years ago. It must be explained that these practices only describe WHAT the best practices are, the execution—or HOW—can vary between plants and also within plants.
I think it can help many organizations to describe some of these practices. It can help you understand the complete maintenance process. You can also use it to educate others and to describe job responsibilities.
We use it to uniformly evaluate essential reliability and maintenance processes. We call them current best practices (CBP) to indicate that this is the best way we know currently—the future will find better practices.
If you want to develop your own CBPs, I advise you to start with structuring the whole concept into key processes, then sub-processes, and then elements of these sub-processes—elements that are the ones we call CBPs.
When you perform this exercise down to the CBPs, you will soon notice that you are back to the very basics of maintenance such as alignment, balancing, filtration, operating practices, etc.
It is still on this level that improvements need to be done in order to increase reliability and lower maintenance costs.
The key processes we identify include: leadership, support facilities, preventive maintenance, planning and scheduling, materials management, technical database, skills development, etc.
For a copy of CBP material, use the links below.
FREE DOWNLOADABLE RESOURCES
Current best practices (pdf) | Current best practices (ppt)
Key Processes
Current Best Practices Continued
Key processes could include leadership, support facilities, preventive maintenance, planning and scheduling, materials management, technical database, skills development, etc.
To give an example of what could be included in a key process, I would like to describe how Part One of the Planning and Scheduling CBP is structured.
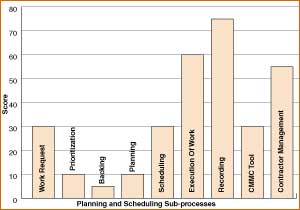
The complete Planning and Scheduling CBP includes:
- Work request
- Prioritization
- Back log management
- Planning
- Scheduling
- Execution
- Recording
- CMMS tool
- Contractor management
Together, these sub-processes comprise about 100 elements.
PLANNING AND SCHEDULING CBP: PART ONE
he following is an example for Part One of the Planning and Scheduling CBP, which is the work request. The minimum requirement for a work request includes:
- Work request is submitted in a computerized maintenance management system (CMMS) and has a work request ID number.
- An accurate requested priority is assigned according to the existing guidelines for priorities.
- Equipment number, originator, description, and/or location is assigned and verified.
- A good work description and/or observed symptoms are recorded.
- Preliminary work order type should be defined as either corrective maintenance or system improvement (expense or capital work).
- How the work affects the process is identified according to the recognized maintenance opportunities.
- Work request is validated.
- Workflow process is followed.
- Known safety requirements are identified.
- Work request can be entered by anyone in the plant.
- Work requests are filtered and collected at a central point.
Use the aforementioned elements to evaluate your own practice in this initial part of planning and scheduling.
Make sure you focus on how well the above is actually executed and not just on how you had intended to execute it.
Let me know if you score yourself better than 75 on a scale of 100.
To score at least 75, you must be able to answer “yes” to all of the following questions:
- Documentation of process exists. It is communicated to all involved in the process.
- Process awareness is evident at hourly workforce level and among all requestors.
- Process is understood and viewed as value added at all levels of the organization.
- True execution of the process is occurring.
It is common to find that very little of the above is documented in a work request. It is more common to find “pump not working” followed by “fix immediately” as the only verbal or written information.
It is also important to note that the beginning of a maintenance job is called a work request – not a work order. Such a designation suggests that there is no guarantee the work will be done just because someone initiated it.
This is an obviously necessary procedure if you want to control costs and prioritize work in the best way.
The chart above shows an example of scores for all planning and scheduling sub-processes.
Has this been helpful?
I hope so.
For more reading, see the articles below.
Read more Articles about Best Practices
Current best practice-an educational journey
Novozyme wins maintenance excellence using IDCON philosophy
What constitutes world-class reliability and maintenance