
Lean maintenance and lean manufacturing – what’s the connection?
Lean manufacturing and lean maintenance are often viewed as separate components of an organization’s improvement strategy. However, to maximize efficiency and reduce waste, these concepts must be understood as interconnected.
This article explores how these two principles—lean manufacturing and lean maintenance—are interdependent, with lean manufacturing focusing on minimizing waste and optimizing production flow, and lean maintenance ensuring equipment reliability to support these goals. Together, they create a sustainable and efficient production environment by harmonizing operational and maintenance strategies to maximize resource utilization and productivity.
Table of Contents
Fundamentals of lean manufacturing
Lean manufacturing focuses on minimizing waste and maximizing value for the customer by optimizing every step of the production chain. Techniques such as value stream mapping are employed to identify inefficiencies and remove non-value-adding activities. Furthermore, tools like Kanban and Heijunka help manage inventory and production scheduling to align with customer demand. The application of these methodologies ensures a smoother flow of materials and information across the production chain. The primary goal is to create a continuous product flow without producing more than is demanded. A critical aspect of this approach is reducing Work In Progress (WIP), which can lead to higher costs and longer lead times.
Lean manufacturing is built on principles designed to optimize production and reduce inefficiencies. Just-in-time production ensures that resources are only utilized when there is a demand, eliminating unnecessary inventory buildup. Identifying and addressing bottlenecks in the production chain is critical to ensuring smooth operations and balanced workflow across all steps. Continuous improvement practices, foster a culture of consistent enhancements to processes, driving efficiency and effectiveness.
Fundamentals of lean maintenance
Lean maintenance ensures that production equipment operates efficiently and reliably, which is essential for achieving lean manufacturing goals. It is a concept that has gained significant traction in both the United States and Europe. Lean maintenance emphasizes that resources should be used judiciously to manufacture and deliver sold products on time, rather than overproducing or creating waste. According to lean maintenance principles, maintenance activities should be meticulously planned and executed with high precision to avoid unnecessary interventions.
Ways to Achieve Lean Maintenance
- Focus on preventive maintenance needs and perform necessary maintenance more effectively.
- Increase production reliability to reduce associated costs, including storage and equipment downtime.
- Use planned maintenance actions to ensure machinery and equipment are ready to meet production demands.
- Employ condition-based maintenance with sensors and data collection to predict and prevent failures before they occur.
- Minimize downtime through careful planning and execution, whether scheduled or unscheduled.
A clear example of lean maintenance in action is the improvement achieved when a organization shifts its focus from merely measuring availability to incorporating quality factors into production reliability assessments. This broader focus on quality, time, and speed enables higher production volumes and better product quality. Furthermore, lean maintenance involves eliminating root causes of recurring problems, fostering collaboration among operations, maintenance, and engineering teams, and leveraging advanced technologies to enhance equipment reliability and maintainability. These measures ensure that maintenance activities contribute directly to achieving lean manufacturing objectives.
The connection between lean manufacturing and lean maintenance
Lean manufacturing and lean maintenance are closely intertwined, forming a synergistic relationship that drives organizational efficiency. Neither can succeed independently, as their principles and practices are mutually reinforcing. By examining their interdependence, we can uncover strategies for maximizing their collective impact.
Reliable equipment serves as the backbone of just-in-time production, a cornerstone of lean manufacturing. High levels of automation depend on flawless equipment performance. Any breakdown in critical machinery can lead to delays, increased WIP, and additional costs. Lean maintenance mitigates these risks by ensuring that equipment reliability aligns with production demands, minimizing disruptions and enabling smooth operational flows.
- Shared Goal of Waste Reduction: Lean maintenance uses proactive approaches like condition-based maintenance to reduce downtime and maintain production efficiency, supporting lean manufacturing’s focus on minimizing WIP and maximizing throughput.
- Cost Efficiency: Investing in equipment reliability through lean maintenance is more economical than expanding capacity, aligning with lean manufacturing’s resource optimization strategies.
- Continuous Improvement: Data-driven insights from maintenance provide feedback to refine production processes, fostering a culture of collaboration and enhancement across the production chain.
Both lean manufacturing and lean maintenance emphasize continuous improvement and operational effectiveness. Together, they create a sustainable production environment where resources are used efficiently, and disruptions are minimized, leading to higher productivity and reduced costs.
Just like manufacturing something before it is sold, maintenance should not be done before it is needed.
Fundamentals of Manufacturing Reliability

It isn’t always obvious where improvements in the manufacturing chain are the most cost effective to implement. Flow of a product is the result of Capacity x Reliability.
At first glance of the image above, it looks as if that C is the bottleneck in the production chain since capacity is 316 pieces per hour compared to the higher capacity in A (356) and B (333). If you calculate the flow, you will find that the bottleneck is in manufacturing stage B. This is compensated and hidden by increasing storage of Work In Progress (WIP) so that it can sometimes seem that throughput is not a problem.
WIP is a big hidden cost for a lot of companies. With low reliability throughput of product in the manufacturing chain it takes a longer time and the costs are increased for the WIP.

By raising the reliability in step C to 83% the increased throughput is 262 per hour. The WIP is reduced since the manufacturing steps are now balanced. Other solutions include procurement of increased capacity through investing in a parallel machine for C.
This would lead to unnecessary high capacity in step C. Moreover, the cost of buying more capacity is at least ten times higher than investing in measures that will increase reliability. Lean manufacturing’s sub-target is to reduce WIP and speed up the throughput in the manufacturing chain.
Reliability includes quality, time, and speed. Lean maintenance has a crucial key role in raising the part of reliability that is affected by the manufacturing equipment. Since the manufacturing process is more and more dependent on automation, good maintenance becomes more and more important.
Availability or reliability?
Many organizations use availability as a key measurement for manufacturing efficiency, but availability encompasses only the percent of planned time, or available time, that a production process produces.
Read this article to learn more about Reliability and Maintenance KPIs you should track.

Availability excludes the quality of that which is produced. To produce something that isn’t up to quality standards are often more expensive then to not produce at all.
To slow down a process because, for example, a part of the production process can’t operate at full speed is also expensive. So, we must focus the improvement initiative on all elements of what we call manufacturing reliability. They are quality, time and speed.
Manufacturing reliability can be measured in various ways. Simply put, it is about how much is manufactured at the right quality divided by how much could have been manufactured at the right quality. Or, % Quality x % Time x % Speed.
Overall, nothing should be manufactured before it has been sold and is to be delivered.
In many heavy process industries people are still living with the thought process to always produce as much as possible.
In “lean thinking” nothing is produced until it needs to be delivered because it has been sold
To be able to produce things “just in time” is only possible if the production reliability is very high.
With a raised automation level, the company becomes more and more dependent on reliable equipment, in other words maintenance. Reliable production equipment is besides better safety, the most important result a maintenance operation generates and it can be seen as the maintenance department’s income generating section.
How to know where the greatest maintenance impact comes from
How much is the difference between how good you are and how good you can become worth?
In a market situation where you can sell everything you can produce the equation is simple. In certain industries the sales price of what you are selling can drastically fluctuate. In that case, you will base your calculations on the average sales price and variable cost over, for example, five years.
| Average Sales price 5 years | $650/unit |
| Average Variable cost 5 years | $430/unit |
| Benefit per produced, sold, and delivered unit | $220/unit |
The value of producing and delivering a sold unit is $220/unit. If you currently produce and deliver 25,000 units per year and your production reliability is 88% but it is possible to reach 94% then the value of increasing production reliability is 6%.
1500 units x $220 = $330,000 per year.
Can you reach better results by focusing on lowering maintenance costs?
Could it be more beneficial to lower maintenance costs if you can maintain Manufacturing reliability at 88%? The answer may seem obvious but it isn’t that unusual that economists are so focused on lowering visible costs that they don’t see the invisible, large opportunities that are concealed in increased production or faster throughput of product.
A concept worth repeating many times is that if you increase manufacturing reliability then manufacturing costs, including maintenance costs will decrease.
If you can’t sell the increased volume that you can reach with the higher manufacturing reliability, then the savings most often lie in more reliable and faster delivery of goods sold, less energy expenditure, much better safety and less overtime.
I’ll give you an example on the impact of reliability in a situation when you cannot sell everything you manufacture if you increase reliability. The example also shows the importance of including the quality component of the reliability formula.
Practical example: Lessons from the pharmaceutical industry
A clear example of the importance of collaboration between lean manufacturing and lean maintenance comes from a pharmaceutical plant. In this plant, a production stoppage occurred due to a simple but critical worn-out V-belt. The stoppage resulted in the loss of $63,000 worth of products. Following the incident, quality metrics were integrated into production reliability measurements. By improving reliability, both downtime and quality losses were reduced, enhancing overall production flow.
Instead of talking in terms of availability this plant now included quality when they identified losses and measured manufacturing reliability. Increased manufacturing reliability will increase product throughput and reduce the time between incoming raw materials to the finished product.
Better reliability is the foundation to a faster and safer manufacturing flow. It lowers losses in delayed deliveries, over production, work in progress and energy expenditure.
What is good manufacturing reliability?
It obviously has to do with your process and equipment quality. Also, pay attention that we aren’t just talking about equipment efficiency.
It is common to use Overall Equipment Efficiency or OEE when measuring manufacturing reliability, but that is only a part of the reliability concept, =The other part is Overall Process Efficiency or OPE which is the manufacturing process, or the chemistry of making your product such as raw materials, pressures, temperatures, chemical mixtures, packaging material, operating practices etc. Learn more about OEE
What is Overall Manufacturing Reliability or OMR?
From the maintenance point of view there are three elements that affect how good OMR can be.
- Equipment quality.
- The number of components that can cause a problem.
- The maintenance organization’s efficiency.
Equipment quality including maintainability and reliability design I have covered in other articles.
I often use paper machines as an example. The most reliable paper machines produce, for example, towel and tissue paper. Such machines often have one or two driers, called Yankee cylinders or driers, each have one drive unit.
A paper machine with several layers and surface coatings has many more components that can cause problems. Such a machine can have over 100 drier cylinders.
Thus, best OMR differs between 96 % for a tissue/towel machine and 82 % for the more complicated machine.
A package line with good OMR can reach 85 – 90 %. All these calculations are based on 8760 hours per year (in 2008 we have 8784 hours per year).
The maintenance organization’s efficiency affects lean maintenance
One of the best indicators of effective maintenance is still how much maintenance work is planned and scheduled before it is executed. This is because it affects both manufacturing reliability and maintenance efficiency to a very high degree.
Furthermore, a high level of planning and scheduling cannot be reached without the support of all the other elements of good maintenance including maintenance prevention, preventive maintenance, storeroom support, root cause problem elimination etc.
In studies that we have performed we have established a strong correlation between high manufacturing reliability and a high degree of planning and scheduling of all maintenance and operations work
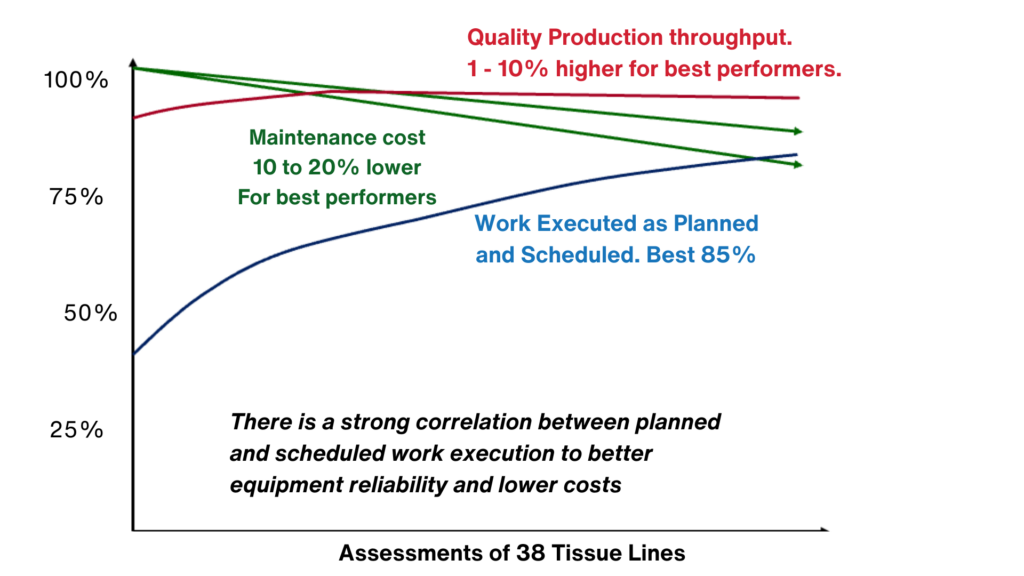
In this study we evaluated the Manufacturing Reliability of 38 very similar process lines. The blue line shows the lowest to the highest manufacturing reliability. The only thing we could correlate to higher manufacturing reliability was the level of professional planning and scheduling. Depending on what different plants included in their maintenance costs, this cost was lower the higher the level of manufacturing reliability and level of planning and scheduling was.
Lean Maintenance’s number 1 “sin”
One the of the biggest sins in lean manufacturing is Over manufacturing. This is when you make more than what has been sold and before it needs to be delivered.
The same view should be taken when it comes to maintenance. To perform more maintenance than is needed or to perform maintenance before it is needed should be considered a waste or an opportunity to improve.
The biggest improvement the opportunities lie
- Optimizing old preventive maintenance systems.
- Decide if work that is performed during scheduled downtime needs to be done.
- Prioritize, plan and schedule work in a disciplined way.
Lean Maintenance – Optimizing Preventive Maintenance (PM)
IDCON has a lot of information about how to optimize PM. Start with our downloadable 8-step guide. We also have an video series on our YouTube Channel about effective PMs.
Optimizing PM can directly relate to lean maintenance Here’s how:
Let’s say you have a PM system where you’ve documented all PM activities under each equipment identification number, your PM optimization can be done relatively quickly. However, if you have a system where all PM inspections and other PM activities are documented in a work order, then the work becomes much more extensive, if not impossible.
If you want to optimize your PM then you must have a system that can collect all PM efforts in a lucid way under respective identities on the maintenance object.
This is important because more than 95% of all PM activities are performed as route-based activities while the manufacturing process is operating. Through more and more integration between what lubricators, mechanics, electricians and operators do, the system must always change and it must be able to change in a very simple way.
It can be easier to start from the beginning with a route-based system if your existing system is based on work orders. A route-based system can be set up at a very low cost. During the 1970’s I led the implementation of many PM systems in industry. I have visited many of those plants and I am surprised to see that many of these systems still looked like they did fifty plus years ago.
The distribution between what is done by different work groups is still the same as back then. In many of these companies the operators are now involved in the preventive maintenance but their efforts are added to all the other PM measures. This represents a big opportunity to optimize PM.
- As an example. In a chemical plant most pump units had the following PM measures done Lubricators lubricate everything, except electric motors.
- Electric motors are lubricated by electricians. (Believe me, even if it is old-school and a waste of the electricians’ skills, it still happens today when you come across old PMs that should have been changed forty years ago)
- A mechanical PM inspector performs mechanical inspections.
- Gear couplings are overhauled during a scheduled shut down each year. (This can easily be moved to inspections while equipment is running and repair are done when needed)
- Electricians and instrument technicians inspect electrical components and sensors.
- Vibration analysis is done by a technician.
- Operators do general inspections of unit
It can be a good idea to take photos of several pieces of the equipment and then show which PM is performed and by whom. Then show how you can integrate and optimize all PM. After that you can determine costs and savings.
Lean Shut Down Management
Depending on the industry a shutdown can be different in scale, for example:
- Several weeks for a stop in an oil refinery.
- Days for a longer shut down in a chemical plant.
- Hours for a recurring shut down in many process industries.
- Minutes for adjustments and tool changes in manufacturing industries.
- Seconds for a Formula 1 or NASCAR pit stop.
NASCAR is a good example of what can be accomplished through precision planning and scheduling and execution. Major contributors to their pit stop, or shut down performance, include operations and maintenance communication and continuously working on improving the basics of Planning and Scheduling, Execution and Root Cause Problem Elimination.
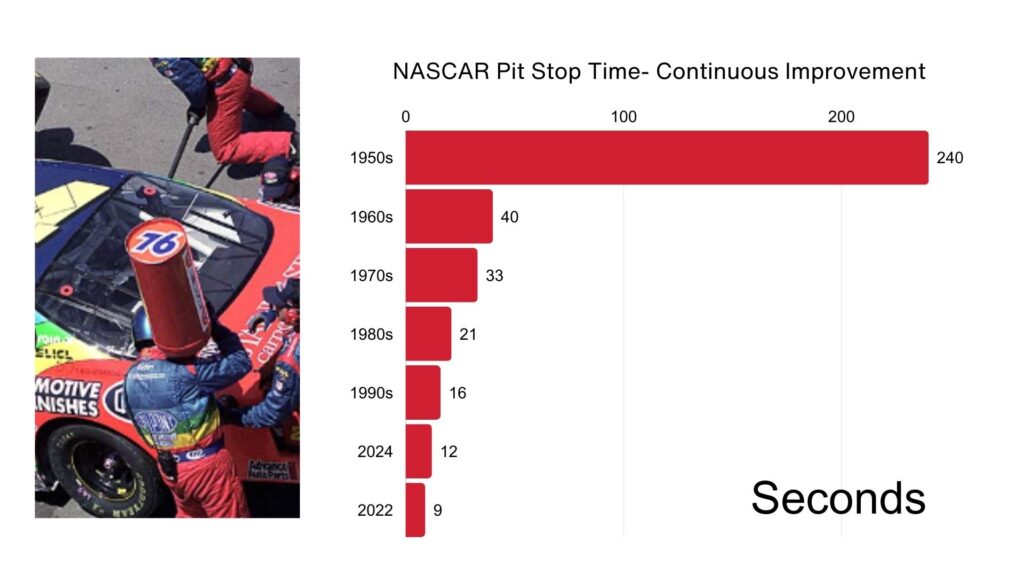
In the 1950s a good pit stop lasted around 240 seconds. If nothing had been done because everyone thought this is very good, then we would still have four minutes pit stops, but the crew that could bring it down to where it is today, at a record 12.6 seconds, would win the race. In 2022, Kyle Bush’s crew set a cup record with an 8.96 -second pit stop.
The driver of the car is in constant contact with the pit stop crew, they do not show up suddenly telling the pit crew “I think I have a problem with the right front tire” and the crew answers “We will go to the store and check if we have a replacement tire”.
But this happens daily in most plants. In a NASCAR race there is a strong motivation to win the race, in a plant there might be completely other factors driving motivation.
In addition to driving Planning and Scheduling to precision and excellence NASCAR pit crews are continuously working on improving the basics. This includes.
- Lug nut tool is turning at 24000 rpm.
- All parts sorted and placed on where they are used.
- Steering wheel straight position is marked.
- Wheel bolts rounded tops.
- Lug nuts glued to wheel.
- IR measurement of tire temperature.
- Measurement of tire wear.
- Marked wheel position to speed up wheel change.
- Wheel nuts painted yellow for visibility.
- Analysis of problems and successes.
- Training 20 hours per week for 20 seconds of work on Sunday.
- Always do work right before fast.
Regardless of the length of the shutdown, the same principles apply to make the shut down more effective or what we like to call lean.
- we should produce without any problems between scheduled shutdowns. Mean Time Between Production Losses (MTBPL) including Quality, Time and Speed) should be as long as possible.
- When we have a shutdown, it must be performed with the right quality on all the jobs and as quickly as possible.
The combination of how many shutdowns you have and how long they are affecting your production volume and your ability to deliver products on time. Learn about IDCON’s 6-phase Shutdown Turnaround Optimization Process (LINK TO STOP PAGE0
It is a given that the shutdown must be scheduled (when and who executes what) and that all the jobs must be planned (what, how, all the tools, spare parts and materials, lock out tag out etc. identified) before the shutdown begins. All shutdowns must have a time when the schedule is frozen. After the freezing point in time no new jobs are accepted without approval from the highest levels.
Two measurements can be used to challenge your organization and to measure and show improvements.
- The number of added on jobs and changed jobs
- The relationship between scheduled and unscheduled shutdowns
Define a shutdown as a scheduled shut down if it is done within the agreed upon timeframe
For example, 44 hours before a shut down for an eight-hour shut down on a larger process line, four weeks before for a three weeklong shut down in an oil refinery and four hours for tool changes that has been scheduled to take approximately forty minutes.
Then measure how many jobs that are added or changed after the freezing point in time and during the shutdown. Scrutinize all the added or changed jobs at latest, three days after the shutdown. Have them explained and learn how they can be avoided next time you have a shut down.
With the same definition as in the previous paragraph, we can measure the relationship between scheduled and unscheduled shutdowns.
For many process industries the quota of the equation is over 1 and should steadily increase. This is on the condition that scheduled shutdowns are not programmed and based on old habits but based on market and condition monitoring of process and equipment.
Do all jobs need to be done during a shut down?
It is not at all unusual that many of the jobs that are performed during a Shutdown are only done because they have always been done and no one has ever questioned if they need to be done or not. During a Strategy Phase of Shutdown Turnaround Optimization, this is a key question.
To know if what you are doing is right you must have a good understanding of the expected life for each respective component.
For example, regularly change a roller bearing after 8000 – 10000 hours of operation time cannot be right. Still, it is a common preventive recommendation from manufacturers.
Recently I discussed the recommendation to change the bearing of a centrifuge once per year. “The centrifuge rotates with a high r.p.m. and if a bearing breaks the rotating unit can cause severe damage, including bodily injury,” was the answer.
According to the bearing manufacturers’ calculations the life for a bearing is between 1 to 15 years. (L10 – L90 life span) It is calculated that ten percent break before one year of operation and ten percent are calculated to last longer than 15 years, in this application.
That fact alone indicates that it is wrong to change the bearings once per year. The bearing that is changed could potentially last for more than ten years whereas the new bearings might not last more than three years. Moreover, you are always risking that a problem will be induced when you change a component. Within reliability theory bearing failures are defined as random failures, you don’t know when failures will occur.
So that means you can’t know when it needs to be changed either. ”Even though I know that it isn’t right to change the bearings, I still do it,” the maintenance manager said to me. ”What do you think would happen if I didn’t change the bearings once a year because I mounted a vibration sensor in the bearings and then measured the condition continuously, so I know when the bearings should be changed and we had a breakdown?”
He continued. ”I can always try to explain to the plant manager, who is an economist, that based on reliability theory it isn’t right to change the bearings once a year, it would instead be correct to base the change on the bearings’ condition.” ”We have, through the years, had several breakdowns, but we always came away without all too harsh words, if we had changed the bearings according to our existing preventive maintenance plan.” The maintenance manager ended with, ”So it isn’t always that easy to become lean even if our plant manager pushes lean manufacturing hard.”
You should also always ask if the jobs that are done during the shutdown could be done during production by using condition monitoring
Lean in Materials and Spare Parts Management
In about 50% of organizations spare parts and materials stores reports to the maintenance organization. In about 50% of organizations spare parts and materials stores is part of purchasing. One of the areas first attacked when an organization wants to become lean is the materials and spare parts areas. Through reducing the value of spare parts and material kept in storage you can, of course, reduce costs. It is true that there are often big opportunities to lower the value in many stores, but it can also become very expensive if it is not done correctly.
One of the most common mistakes is to discard parts that haven’t been used in, for example, the past five years or more. To discard these parts because they have not been used for a long time is way too simplified and risky and I am surprised every time I see that this tactic is still being used.
That these incorrect and expensive cutbacks happen is a result of that the people in charge of the stores often having the goal of reducing the store value, while the consequences of not having the right part in storage when the parts are needed, is a problem for those responsible for operations and maintenance. Most stores, especially in plants that are ten or more years old, can reduce their value by 10 to 20% without negatively affecting production reliability.
To successfully, and sustainably, reduce the value of parts and material kept in stores you must focus on measures that drives down the cost, not only on reducing the store value.
You should also set up a measurable goal for this effort. The goal could for example be “With a service factor maintained at 97 % we will reduce value of inventory kept in stores”. In this case the service factor is percent of occasions the right parts/material have been available when needed for a maintenance job.
Reducing the Parts and Materials Inventory the right way (h2)The number 1 thing you must know is what parts and materials are in your stores.
First do a quick evaluation of how accurate the inventory list is. Randomly choose 300 to 500 items and compare how correct the balance is, the location in the stores, etc.
We have often found that the inventory catalogue is 70% accurate while a good value would be 98%+. Even if this accuracy value is 100% it does not mean that the stores are cost effective. Do we have the right items? Do we have too many?
How many spare parts are in undocumented storage?
If the inventory catalogue and/or the plant register, including component record and spare parts documented for each piece of equipment, are not accurate and reliable, then the users will not trust that the articles they need are going to be available in the store when they need them.
This is one reason why people start building up their own stores. These stores can become extensive and very expensive to have. The costs are invisible. More articles are purchased before they are needed and often in greater quantities than necessary.
Moreover, the items are often stored in a poor environment where damage by corrosion, dirt, vibrations, etc. can happen. It is imperative to clean up, sort, organize and document all the items in all these storages.
The store manager will most likely not want to take all these items back in the central stores, because this would increase stores value and take up costly space.
I call these undocumented stores emotional stores. If you have made efforts to document all these stores and then take away all parts in these stores from the people who have them, and put the parts in central stores, then you will understand why I call them emotional stores.
Decide what you are going to have in storage
In addition to known and traditional methods and data used to decide what should be kept in storage such as delivery times, economic purchasing quantities, consumption statistics etc. it is not uncommon that information such as
- risk for breakdown of a component
- cost if an article is not in storage when it is needed
- condition monitoring based storage,
- number of identical parts used in the plant equipment etc. are missing
Then only guesses are made as to what should and should not be kept in storage. It is important that an analysis has been done on what production equipment is critical and which components within each piece of critical equipment could cause a breakdown.
The breakdown cost compared to the cost of keeping parts in store is an important piece of information that should be taken into consideration when storage levels are decided.
With good condition monitoring you can often avoid keeping parts in storage if the so-called failure developing period is longer than the delivery time of the parts you are monitoring.
A practical example is chains and sprockets made of steel. They wear down over a longer time, they are easy to inspect with objective methods and the delivery time of replacement sprockets and chains are often short. If you monitor wear of sprockets and chains you can order them when you need them instead of keeping them in store.
With an accurate inventory catalogue and/or the plant equipment record, (Bill of Material) including spare parts documented for each piece of equipment you will know how many identical articles are included in the production equipment.
This is necessary and important information to have when evaluating suppliers’ recommendations and decisions on what to keep in stores. The absence of an accurate Bill Of Material will lead to that you keep wrong parts and in the wrong quantities in your stores.
Standardization can also reduce storage substantially. If you have a production line with 22 or so different and critical, electrical motors you might decide to keep one of each of the 22 motors in the storage. You can often standardize to use about five different motors or even just one type. Then only five or maybe just one motor is kept in storage.
Conclusion
Achieving an efficient and sustainable production chain requires a strong collaboration between lean manufacturing and lean maintenance. Manufacturing reliability is the key to reducing waste, increasing production speed, and ensuring on-time delivery of high-quality products. Lean maintenance serves as a foundational support function that enables the goals of lean manufacturing to be realized. By integrating the principles of both areas, organizations can create a production environment where resources are optimally utilized, customers are satisfied, and costs are effectively controlled.